ARCTIC PACER clustering project has collected a series of good practices identified by the projects participating. This week we would like to present you another example from the BitStream II project, led by Umeå University (Sweden): the ‘Method for social and participative innovation’, which intends to allow different stakeholders to participate in digitally based co-design of public services.
This good practice is based on four tools: Lean canvas, Mash-up, customer journeys and sensors that gather data on how citizens use public services, which then could be used to improve existing services or develop new ones. The method is tested in Norsjö village (Västerbotten County, Sweden). “We set up a LoRaWan network in Norsjö that can be described as a star topology with gateways as bridges between sensors and a central server. LoRa was chosen since that it is an open and widely spread platform, including an open, non-profit association sharing their experiences. By placing two gateways at central locations in Norsjö, the network covers a large part of the central village area. Each gateway is expected to cover a radius of three kilometres. The reason for also including the outskirts of the town is to cover leisure areas such as cross-country skiing tracks, cross-training tracks, barbecue areas, and areas for swimming and hiking”, explains ARCTIC CLUSTER partner Mikael Söderström from Umeå University.
BitStream II partners have conducted three major tests of the LoRaWAN network: (1) Sensors placed at the cross-country skiing trail, (2) Sensors placed at the public bath, and (3) Sensors placed in four classrooms, and in the canteen at the local school. “In all three tests we also have developed visualizations of the sensor data with the purpose of communicate information to the general public and to create a discussion of the quality of the services provided by Norsjö municipality”, adds Söderström.
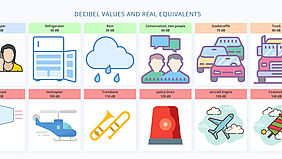
Check some of the visualization tools developed: the sound level in the four classrooms and in the canteen and the visualization of sensor data from the cross-country skiing trail test.

